Introduction
Time series forecasting is essential in finance for trading, risk management, and strategic planning. However, predicting financial asset prices remains challenging due to market volatility. Whether you believe financial forecasting is possible or your role requires it, TimeGPT simplifies the process. This tutorial demonstrates how to use TimeGPT for Bitcoin price prediction and uncertainty quantification for risk management.Why Forecast Bitcoin Prices
Bitcoin (₿), the first decentralized cryptocurrency, records transactions on a blockchain. Bitcoins are mined by solving cryptographic tasks and can be used for payments, trading, or investment. Bitcoin’s volatility and popularity make price forecasting valuable for trading strategies and risk management.What You’ll Learn
- How to load and prepare Bitcoin price data
- How to generate short-term forecasts with TimeGPT
- How to visualize and interpret forecast results
- How to detect anomalies and add exogenous variables
How to Forecast Bitcoin Prices with TimeGPT
Step 1: Load Bitcoin Price Data
Start by loading the Bitcoin price data:| Date | Close | |
|---|---|---|
| 0 | 2020-01-01 | 7200.174316 |
| 1 | 2020-01-02 | 6985.470215 |
| 2 | 2020-01-03 | 7344.884277 |
| 3 | 2020-01-04 | 7410.656738 |
| 4 | 2020-01-05 | 7411.317383 |
ds (date) and y (target) format.
Step 2: Get Started with TimeGPT
Initialize theNixtlaClient with your Nixtla API key. To learn more about how to set up your API key, see Setting up your API key.
Step 3: Visualize the Data
Before attempting any forecasting, it is good practice to visualize the data we want to predict. TheNixtlaClient class includes a plot method for this purpose.
The plot method has an engine argument that allows you to choose between different plotting libraries. Default is matplotlib, but you can also use plotly for interactive plots.

Step 4: Forecast with TimeGPT
Now we are ready to generate predictions with TimeGPT. To do this, we will use theforecast method from the NixtlaClient class.
The forecast method requires the following arguments:
df: The DataFrame containing the time series datah: (int) The forecast horizon. In this case, we will forecast the next 7 days.level: (list) The confidence level for the prediction intervals. Given the inherent volatility of Bitcoin, we will use multiple confidence levels.
| ds | TimeGPT | TimeGPT-lo-90 | TimeGPT-lo-80 | TimeGPT-lo-50 | TimeGPT-hi-50 | TimeGPT-hi-80 | TimeGPT-hi-90 | |
|---|---|---|---|---|---|---|---|---|
| 0 | 2024-01-01 | 42269.460938 | 39567.209020 | 40429.953636 | 41380.654646 | 43158.267229 | 44108.968239 | 44971.712855 |
| 1 | 2024-01-02 | 42469.917969 | 39697.941669 | 40578.197049 | 41466.511361 | 43473.324576 | 44361.638888 | 45241.894268 |
| 2 | 2024-01-03 | 42864.078125 | 40538.871243 | 41586.252507 | 42284.316674 | 43443.839576 | 44141.903743 | 45189.285007 |
| 3 | 2024-01-04 | 42881.621094 | 40603.117448 | 41216.106493 | 42058.539392 | 43704.702795 | 44547.135694 | 45160.124739 |
| 4 | 2024-01-05 | 42773.457031 | 40213.699760 | 40665.384780 | 41489.812431 | 44057.101632 | 44881.529282 | 45333.214302 |
plot method to visualize the predictions with the historical data.
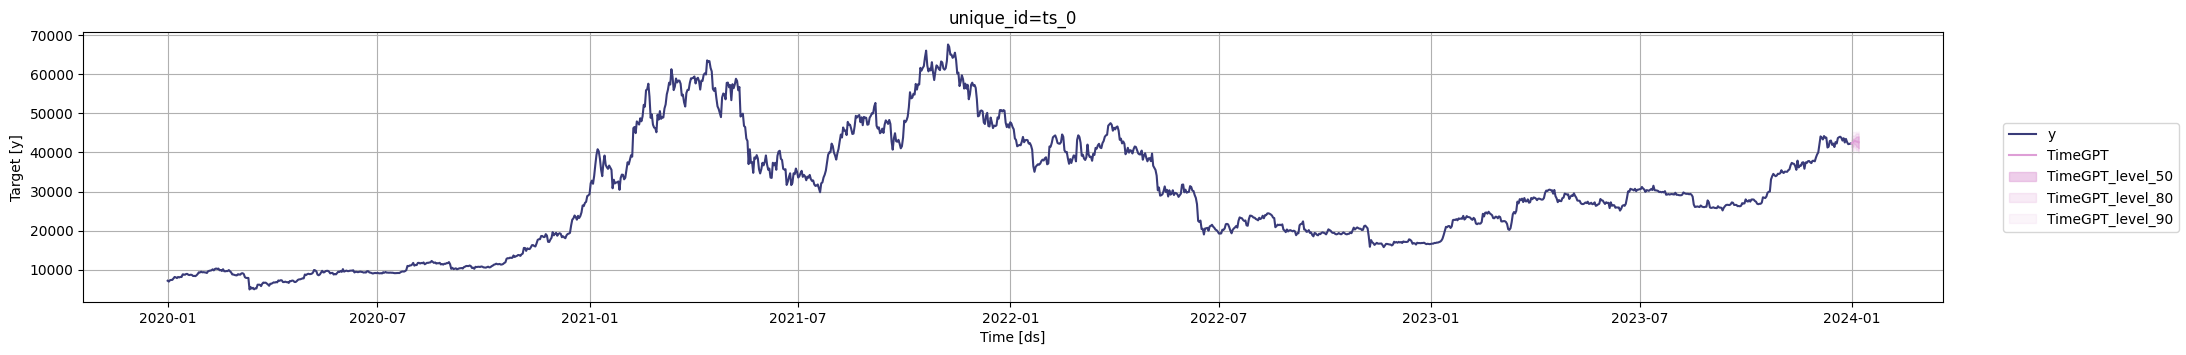
max_insample_length argument. Note that setting max_insample_length=60, for instance, will display the last 60 historical values along with the complete forecast.

Step 5: Extend Bitcoin Price Analysis with TimeGPT
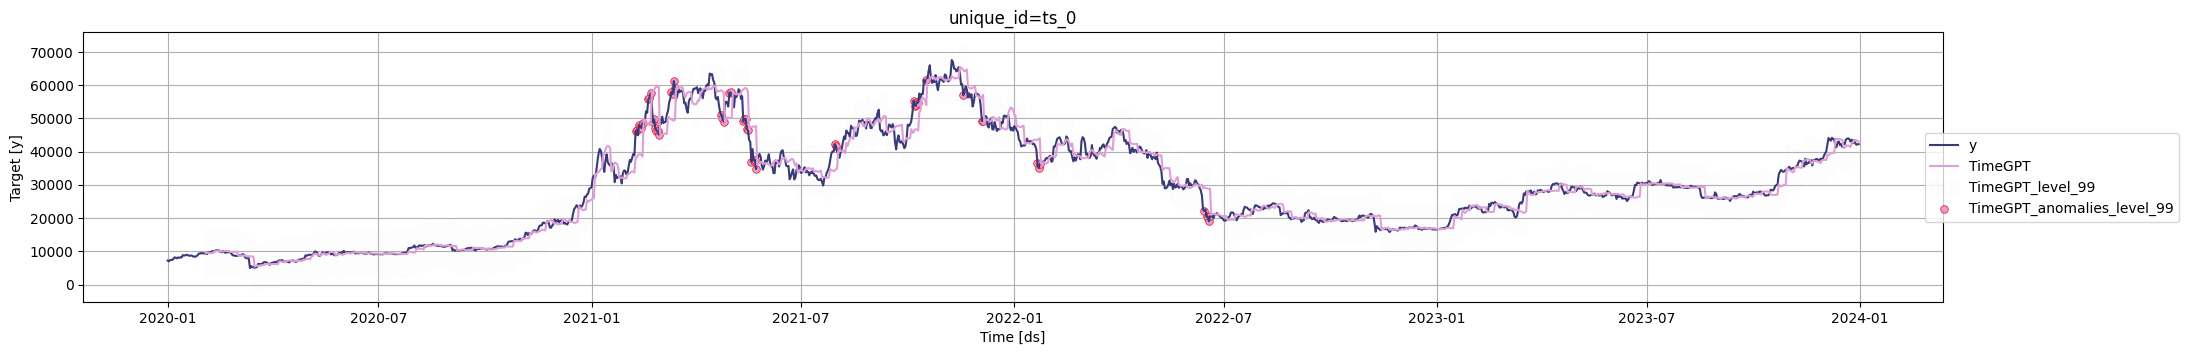
Anomaly Detection
Given Bitcoin’s volatility, identifying anomalies can be valuable. Use TimeGPT’sdetect_anomalies method to evaluate each observation statistically within its series context. By default, it identifies anomalies using a 99% prediction interval, which you can adjust with the level argument.
Add Exogenous Variables
To improve forecasts, include relevant data as exogenous variables, such as other cryptocurrency prices, stock market indices, or Bitcoin network transaction volumes. To learn how to incorporate exogenous variables to TimeGPT, see Numeric Features Guide.Understand the Model Limitations
As stated in the introduction, predicting Bitcoin prices is challenging. The predictions here may appear accurate because they use recent data and update frequently, but the real test is forecasting future prices, not historical performance. For those who need or want to try to forecast these assets,TimeGPT can be an option that simplifies the forecasting process. With just a couple of lines of code, TimeGPT can help you:
- Produce point forecasts
- Quantify the uncertainty of your predictions
- Produce in-sample forecasts
- Detect anomalies
- Incorporate exogenous variables
Conclusion
TimeGPT simplifies Bitcoin price forecasting by providing:- Accurate short-term predictions with quantified uncertainty
- Automated anomaly detection for risk management
- Support for exogenous variables to improve forecast accuracy
Next Steps
- Explore energy demand forecasting with TimeGPT
- Learn about cross-validation for model evaluation
- Understand fine-tuning for improved accuracy
- Scale forecasts with distributed computing