TimeGPT-1 Family - Foundation Models for Time Series Forecasting
TimeGPT is a production-ready generative pretrained transformer for time series forecasting and predictions. It delivers accurate forecasts for retail sales, electricity demand, financial markets, and IoT sensor data with just a few lines of Python code. This quickstart guide will have you making your first forecast in under 5 minutes!Set Up TimeGPT for Python Time Series Forecasting
Step 1: Get an API Key
- Visit dashboard to activate your free trial and create an account.
- Sign in using Google, GitHub, or your email.
- Navigate to API Keys in the menu and select Create New API Key.
- Your new API key will appear on the screen. Copy this key and save it in a safe place for use later.

Step 2: Install Nixtla
Install the Nixtla library in your preferred Python environment:Step 3: Import the Nixtla TimeGPT client
Import the Nixtla client and instantiate it with your API key:Step 4: Verify your API key
Verify the status and validity of your API key:For enhanced security practices, see our guide on
Setting Up your API Key.
Make Your First Time Series Forecast
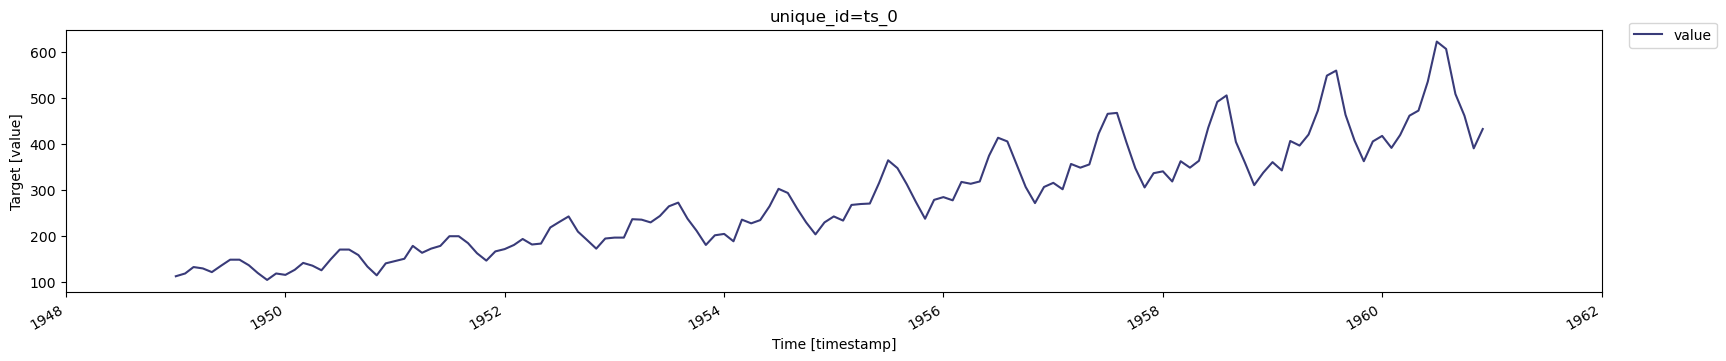
We’ll demonstrate TimeGPT’s forecasting capabilities using the classicAirPassengers dataset, a monthly time series showing international airline passengers from 1949 to 1960.
| timestamp | value | |
|---|---|---|
| 0 | 1949-01-01 | 112 |
| 1 | 1949-02-01 | 118 |
| 2 | 1949-03-01 | 132 |
| 3 | 1949-04-01 | 129 |
| 4 | 1949-05-01 | 121 |
If you are using your own data, here are the data requirements:
- The target variable must not contain missing or non-numeric values.
- The timestamp column must not contain missing values.
- Date stamps must form a continuous sequence without gaps for the selected frequency.
- pandas must be able to parse the timestamp column as datetime objects. (see Pandas documentation).
plot method automatically displays figures in notebook environments. To save a plot locally:
Real-World Forecasting Applications
TimeGPT excels at:- Retail forecasting: Predict product demand and inventory needs
- Energy forecasting: Forecast electricity consumption and renewable energy production
- Financial forecasting: Project revenue, sales, and market trends
- IoT predictions: Anticipate sensor readings and equipment metrics
Short and Long-Term Forecasting Examples
Generate a longer-term forecast
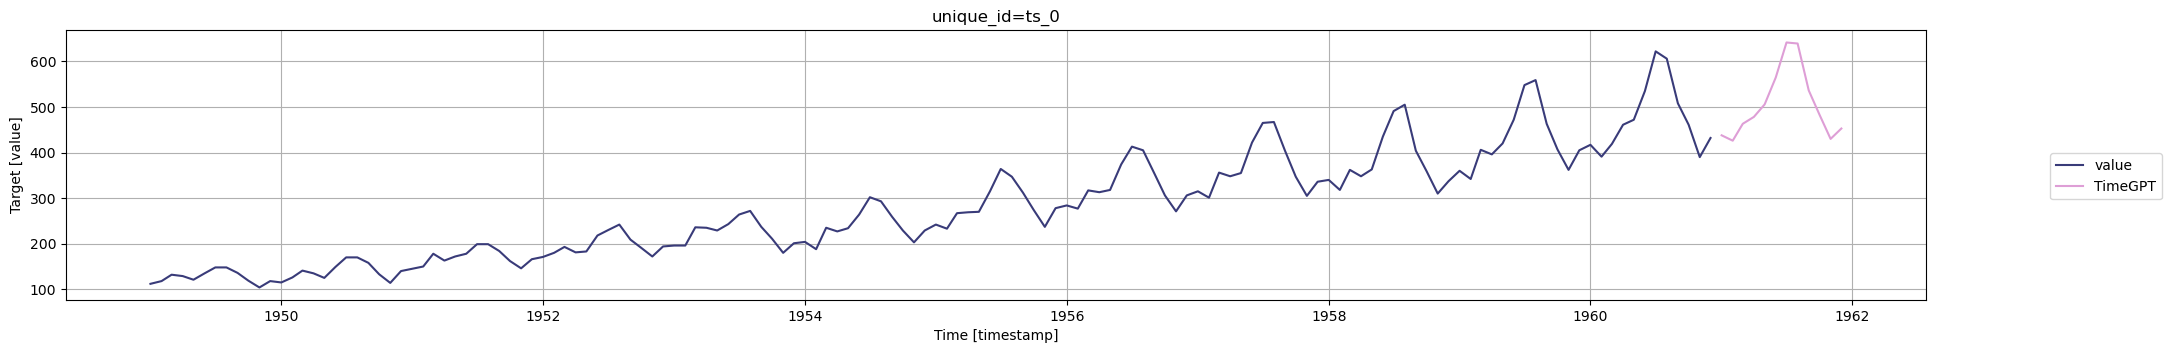
Forecast the next 12 months using the SDK’sforecast method:
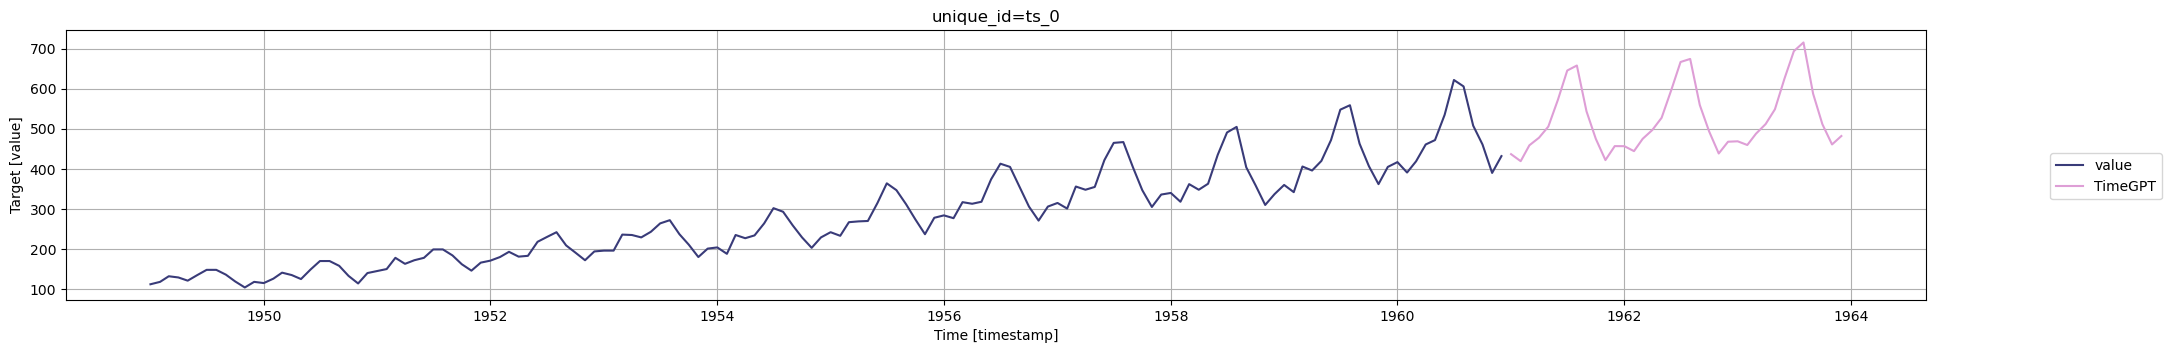
timegpt-1-long-horizon model. For example, 36 months ahead:
Generate a shorter-term forecast
Forecast the next 6 months with a single command: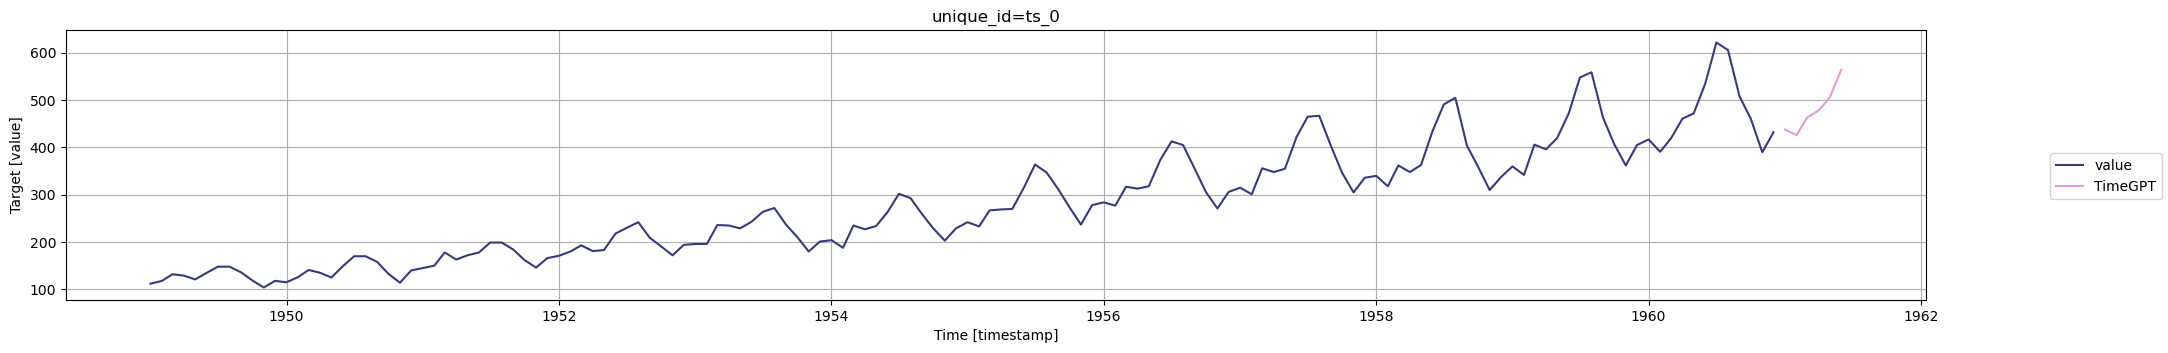
Frequently Asked Questions
How accurate is TimeGPT for forecasting?
TimeGPT achieves state-of-the-art accuracy across multiple domains including retail, finance, and electricity forecasting with zero-shot learning.Can I use TimeGPT with my own time series data?
Yes, TimeGPT works with any time series data in pandas DataFrame format with a timestamp and target value column.How long does it take to generate forecasts?
TimeGPT typically generates forecasts in seconds, making it suitable for production environments.Next Steps
Now that you’ve made your first forecast, explore these tutorials to unlock TimeGPT’s full capabilities:- Improve Accuracy - Advanced techniques to enhance forecast accuracy
- Fine-Tuning - Customize TimeGPT for your specific data
- Exogenous Variables - Include external variables in forecasts
- Uncertainty Quantification - Generate prediction intervals and quantile forecasts
- Cross-Validation - Assess forecast performance
- Forecasting at Scale - Process thousands of time series
- Anomaly Detection - Identify outliers in your data