> ## Documentation Index
> Fetch the complete documentation index at: https://nixtla.io/docs/llms.txt
> Use this file to discover all available pages before exploring further.
# Quickstart (TimeGPT-1)
> Learn how to use TimeGPT for accurate time series forecasting
## TimeGPT-1 Family - Foundation Models for Time Series Forecasting
TimeGPT is a production-ready generative pretrained transformer for time series forecasting and predictions. It delivers accurate forecasts for retail sales, electricity demand, financial markets, and IoT sensor data with just a few lines of Python code. This quickstart guide will have you making your first forecast in under 5 minutes!
## Set Up TimeGPT for Python Time Series Forecasting
### Step 1: Get an API Key
* Visit [dashboard](https://nixtla.io/free-trial?utm_source=nixtla.io\&utm_campaign=/docs/forecasting/timegpt_quickstart) to activate your free trial and create an account.
* Sign in using Google, GitHub, or your email.
* Navigate to **API Keys** in the menu and select **Create New API Key**.
* Your new API key will appear on the screen. Copy this key and save it in a safe place for use later.

### Step 2: Install Nixtla
Install the Nixtla library in your preferred Python environment:
```bash theme={null}
pip install nixtla
```
### Step 3: Import the Nixtla TimeGPT client
Import the Nixtla client and instantiate it with your API key:
```python theme={null}
from nixtla import NixtlaClient
nixtla_client = NixtlaClient(
api_key='my_api_key_provided_by_nixtla'
)
```
### Step 4: Verify your API key
Verify the status and validity of your API key:
```python theme={null}
nixtla_client.validate_api_key()
```
```bash theme={null}
True
```
For enhanced security practices, see our guide on
[Setting Up your API Key](/setup/setting_up_your_api_key).
## Make Your First Time Series Forecast
We'll demonstrate TimeGPT's forecasting capabilities using the classic `AirPassengers` dataset, a monthly time series showing international airline passengers from 1949 to 1960.
```python theme={null}
import pandas as pd
df = pd.read_csv('https://raw.githubusercontent.com/Nixtla/transfer-learning-time-series/main/datasets/air_passengers.csv')
df.head()
```
| | timestamp | value |
| - | ---------- | ----- |
| 0 | 1949-01-01 | 112 |
| 1 | 1949-02-01 | 118 |
| 2 | 1949-03-01 | 132 |
| 3 | 1949-04-01 | 129 |
| 4 | 1949-05-01 | 121 |
If you are using your own data, here are the data requirements:
* The target variable must not contain missing or non-numeric values.
* The timestamp column must not contain missing values.
* Date stamps must form a continuous sequence without gaps for the selected frequency.
* pandas must be able to parse the timestamp column as datetime objects. ([see Pandas documentation](https://pandas.pydata.org/docs/reference/api/pandas.to_datetime.html)).
For more details, visit [Data Requirements](/data_requirements/data_requirements).
Plot the dataset:
```python theme={null}
nixtla_client.plot(df, time_col='timestamp', target_col='value')
```
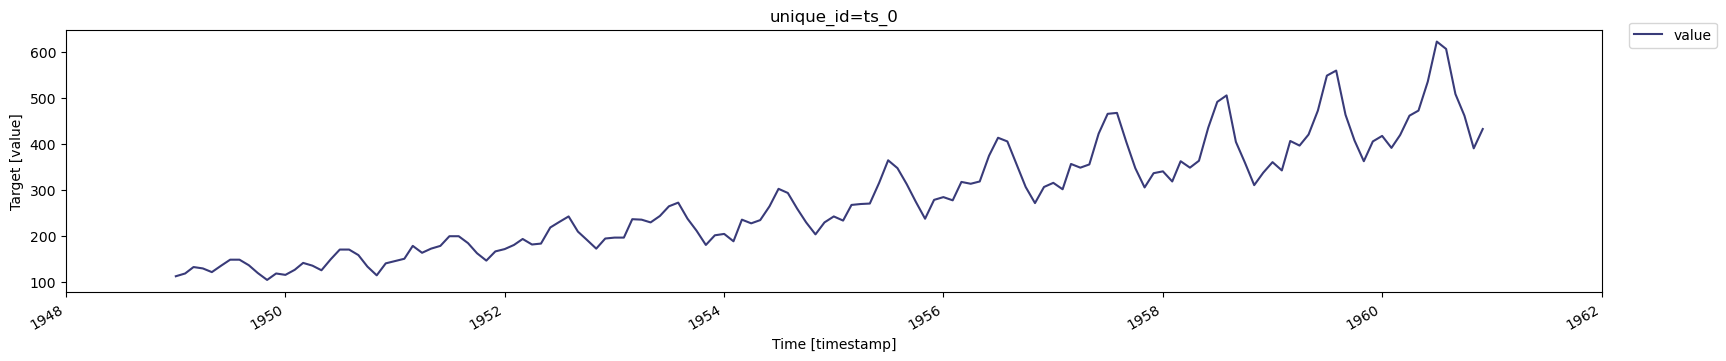
The `plot` method automatically displays figures in notebook environments. To save a plot locally:
```python theme={null}
fig = nixtla_client.plot(df, time_col='timestamp', target_col='value')
fig.savefig('plot.png', bbox_inches='tight')
```
## Real-World Forecasting Applications
TimeGPT excels at:
* **Retail forecasting**: Predict product demand and inventory needs
* **Energy forecasting**: Forecast electricity consumption and renewable energy production
* **Financial forecasting**: Project revenue, sales, and market trends
* **IoT predictions**: Anticipate sensor readings and equipment metrics
## Short and Long-Term Forecasting Examples
### Generate a longer-term forecast
Forecast the next 12 months using the SDK's `forecast` method:
```python theme={null}
timegpt_fcst_df = nixtla_client.forecast(
df=df,
h=12,
freq='MS',
time_col='timestamp',
target_col='value'
)
timegpt_fcst_df.head()
```
Plot the forecast:
```python theme={null}
nixtla_client.plot(df, timegpt_fcst_df, time_col='timestamp', target_col='value')
```

You may also generate forecasts for longer horizons with the `timegpt-1-long-horizon` model. For example, 36 months ahead:
```python theme={null}
timegpt_fcst_df = nixtla_client.forecast(
df=df,
h=36,
freq='MS',
time_col='timestamp',
target_col='value',
model='timegpt-1-long-horizon'
)
timegpt_fcst_df.head()
```
Plot the forecast:
```python theme={null}
nixtla_client.plot(df, timegpt_fcst_df, time_col='timestamp', target_col='value')
```

### Generate a shorter-term forecast
Forecast the next 6 months with a single command:
```python theme={null}
timegpt_fcst_df = nixtla_client.forecast(
df=df,
h=6,
freq='MS',
time_col='timestamp',
target_col='value'
)
```
Plot the forecast:
```python theme={null}
nixtla_client.plot(df, timegpt_fcst_df, time_col='timestamp', target_col='value')
```

## Frequently Asked Questions
### How accurate is TimeGPT for forecasting?
TimeGPT achieves state-of-the-art accuracy across multiple domains including retail, finance, and electricity forecasting with zero-shot learning.
### Can I use TimeGPT with my own time series data?
Yes, TimeGPT works with any time series data in pandas DataFrame format with a timestamp and target value column.
### How long does it take to generate forecasts?
TimeGPT typically generates forecasts in seconds, making it suitable for production environments.
## Next Steps
Now that you've made your first forecast, explore these tutorials to unlock TimeGPT's full capabilities:
* [Improve Accuracy](/forecasting/improve_accuracy) - Advanced techniques to enhance forecast accuracy
* [Fine-Tuning](/forecasting/fine-tuning/steps) - Customize TimeGPT for your specific data
* [Exogenous Variables](/forecasting/exogenous-variables/numeric_features) - Include external variables in forecasts
* [Uncertainty Quantification](/forecasting/probabilistic/introduction) - Generate prediction intervals and quantile forecasts
* [Cross-Validation](/forecasting/evaluation/cross_validation) - Assess forecast performance
* [Forecasting at Scale](/forecasting/forecasting-at-scale/computing_at_scale) - Process thousands of time series
* [Anomaly Detection](/anomaly_detection/historical_anomaly_detection) - Identify outliers in your data