> ## Documentation Index
> Fetch the complete documentation index at: https://nixtla.io/docs/llms.txt
> Use this file to discover all available pages before exploring further.
# Holidays & Special Dates
> Guide to using holiday calendar variables and special dates to improve forecast accuracy in time series.
## What Are Holiday Variables and Special Dates?
Special dates, such as holidays, promotions, or significant events, often cause notable deviations from normal patterns in your time series. By incorporating these special dates into your forecasting model, you can better capture these expected variations and improve prediction accuracy.
## How to Add Holiday Variables and Special Dates
[](https://colab.research.google.com/github/Nixtla/nixtla/blob/main/nbs/docs/tutorials/02_holidays.ipynb)
### Step 1: Import Packages
Import the required libraries and initialize the Nixtla client.
```python theme={null}
import pandas as pd
from nixtla import NixtlaClient
```
```python theme={null}
nixtla_client = NixtlaClient(
api_key='my_api_key_provided_by_nixtla'
)
```
### Step 2: Load Data
We use a Google Trends dataset on "chocolate" with monthly frequency:
```python theme={null}
df = pd.read_csv('https://raw.githubusercontent.com/Nixtla/transfer-learning-time-series/main/datasets/google_trend_chocolate.csv')
df['month'] = pd.to_datetime(df['month']).dt.to_period('M').dt.to_timestamp('M')
df.head()
```
| | month | chocolate |
| - | ---------- | --------- |
| 0 | 2004-01-31 | 35 |
| 1 | 2004-02-29 | 45 |
| 2 | 2004-03-31 | 28 |
| 3 | 2004-04-30 | 30 |
| 4 | 2004-05-31 | 29 |
### Step 3: Create a Future Dataframe
When adding exogenous variables (like holidays) to time series forecasting, we need a future DataFrame because:
* Historical data already exists: Our training data contains past values of both the target variable and exogenous features
* Future exogenous features are known: Unlike the target variable, we can determine future values of exogenous features (like holidays) in advance
For example, we know that Christmas will occur on December 25th next year, so we can include this information in our future DataFrame to help the model understand seasonal patterns during the forecast period.
Start with creating a future DataFrame with 14 months of dates starting from May 2024.
```python theme={null}
# Create future Dataframe for adding US holidays
start_date = "2024-05"
dates = pd.date_range(start=start_date, periods=14, freq="ME")
dates = dates.to_period("M").to_timestamp("M")
future_df = pd.DataFrame(dates, columns=["month"])
future_df.tail()
```
| | month |
| -- | ------------------- |
| 9 | 2025-02-28 00:00:00 |
| 10 | 2025-03-31 00:00:00 |
| 11 | 2025-04-30 00:00:00 |
| 12 | 2025-05-31 00:00:00 |
| 13 | 2025-06-30 00:00:00 |
### Step 4: Forecast with Holidays and Special Dates
TimeGPT automatically generates standard date-based features (like month, day of week, etc.) during forecasting. For more specialized temporal patterns, you can manually add holiday indicators to both your historical and future datasets.
#### Create a Function to Add Date Features
To make it easier to add date features to a DataFrame, we'll create the `add_date_features_to_DataFrame` function that takes:
* A pandas DataFrame
* A date extractor function, which can be `CountryHolidays` or `SpecialDates`
* A time column name
```python theme={null}
def add_date_features_to_dataframe(df, date_extractor, time_col="month", freq="ME"):
# Create a copy of the DataFrame
df = df.copy()
# Ensure time column is datetime
datetime_types = ["datetime64[ns]", "datetime64[us]", "datetime64[ms]"]
if df[time_col].dtype.name not in datetime_types:
raise ValueError(
f"Column '{time_col}' must be datetime type, got {df[time_col].dtype}"
)
# Create date range
dates_range = pd.date_range(
start=df[time_col].min(), end=df[time_col].max(), freq="D"
)
# Get date feature indicators and resample to specified frequency
features_df = date_extractor(dates_range)
features = features_df.resample(freq).max()
features = features.reset_index(names=time_col)
# Merge with input DataFrame
result_df = df.merge(features)
return result_df
```
#### Add Holiday Features
To add holiday features, we'll use the `CountryHolidays` class to compute US holidays and merge them into the future DataFrame.
```python theme={null}
from nixtla.date_features import CountryHolidays
us_holidays = CountryHolidays(countries=["US"])
future_df_holidays = add_date_features_to_DataFrame(future_df, us_holidays)
print(f"Future DataFrame shape: {future_df_holidays.shape}")
future_df_holidays.head()
```
| | month | US\_New Year's Day | US\_Memorial Day | US\_Juneteenth National Independence Day | US\_Independence Day | US\_Labor Day | US\_Veterans Day | US\_Thanksgiving Day | US\_Christmas Day | US\_Martin Luther King Jr. Day | US\_Washington's Birthday | US\_Columbus Day |
| -: | :------------------ | -----------------: | ---------------: | ---------------------------------------: | -------------------: | ------------: | ---------------: | -------------------: | ----------------: | -----------------------------: | ------------------------: | ---------------: |
| 0 | 2024-05-31 00:00:00 | 0 | 0 | 0 | 0 | 0 | 0 | 0 | 0 | 0 | 0 | 0 |
| 1 | 2024-06-30 00:00:00 | 0 | 0 | 1 | 0 | 0 | 0 | 0 | 0 | 0 | 0 | 0 |
| 2 | 2024-07-31 00:00:00 | 0 | 0 | 0 | 1 | 0 | 0 | 0 | 0 | 0 | 0 | 0 |
| 3 | 2024-08-31 00:00:00 | 0 | 0 | 0 | 0 | 0 | 0 | 0 | 0 | 0 | 0 | 0 |
| 4 | 2024-09-30 00:00:00 | 0 | 0 | 0 | 0 | 1 | 0 | 0 | 0 | 0 | 0 | 0 |
This DataFrame now includes columns for each identified US holiday as binary indicators.
Next, add holiday indicators to the historical DataFrame.
```python theme={null}
df_with_holidays = add_date_features_to_DataFrame(df, us_holidays)
df_with_holidays.tail()
```
| | month | chocolate | US\_New Year's Day | US\_New Year's Day (observed) | US\_Memorial Day | US\_Independence Day | US\_Independence Day (observed) | US\_Labor Day | US\_Veterans Day | US\_Thanksgiving Day | US\_Christmas Day | US\_Christmas Day (observed) | US\_Martin Luther King Jr. Day | US\_Washington's Birthday | US\_Columbus Day | US\_Veterans Day (observed) | US\_Juneteenth National Independence Day | US\_Juneteenth National Independence Day (observed) |
| --: | :------------------ | --------: | -----------------: | ----------------------------: | ---------------: | -------------------: | ------------------------------: | ------------: | ---------------: | -------------------: | ----------------: | ---------------------------: | -----------------------------: | ------------------------: | ---------------: | --------------------------: | ---------------------------------------: | --------------------------------------------------: |
| 239 | 2023-12-31 00:00:00 | 90 | 0 | 0 | 0 | 0 | 0 | 0 | 0 | 0 | 1 | 0 | 0 | 0 | 0 | 0 | 0 | 0 |
| 240 | 2024-01-31 00:00:00 | 64 | 1 | 0 | 0 | 0 | 0 | 0 | 0 | 0 | 0 | 0 | 1 | 0 | 0 | 0 | 0 | 0 |
| 241 | 2024-02-29 00:00:00 | 66 | 0 | 0 | 0 | 0 | 0 | 0 | 0 | 0 | 0 | 0 | 0 | 1 | 0 | 0 | 0 | 0 |
| 242 | 2024-03-31 00:00:00 | 59 | 0 | 0 | 0 | 0 | 0 | 0 | 0 | 0 | 0 | 0 | 0 | 0 | 0 | 0 | 0 | 0 |
| 243 | 2024-04-30 00:00:00 | 51 | 0 | 0 | 0 | 0 | 0 | 0 | 0 | 0 | 0 | 0 | 0 | 0 | 0 | 0 | 0 | 0 |
Now, your historical DataFrame also contains holiday flags for each month.
Finally, forecast with the holiday features.
```python theme={null}
fcst_df_holidays = nixtla_client.forecast(
df=df_with_holidays,
h=14,
freq="ME",
time_col="month",
target_col="chocolate",
X_df=future_df_holidays,
model="timegpt-1-long-horizon",
hist_exog_list=[
"US_New Year's Day (observed)",
"US_Independence Day (observed)",
"US_Christmas Day (observed)",
"US_Veterans Day (observed)",
"US_Juneteenth National Independence Day (observed)",
],
feature_contributions=True, # for shapley values
)
fcst_df_holidays.head()
```
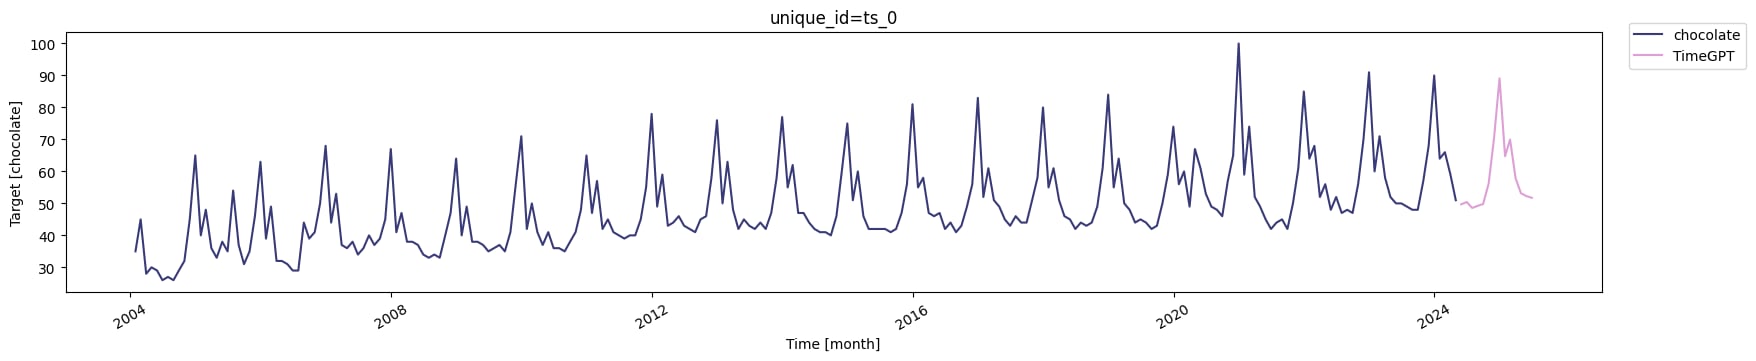
Plot the forecast with holiday effects.
```python theme={null}
nixtla_client.plot(
df_with_holidays,
fcst_df_holidays,
time_col='month',
target_col='chocolate',
)
```

We can then plot the weights of each holiday to see which are more important in forecasting the interest in chocolate. We will use the [SHAP library](https://shap.readthedocs.io/en/latest/) to plot the weights.
> For more details on how to use the shap library, see our [tutorial on model interpretability](/docs/forecasting/exogenous-variables/interpretability_with_shap).
```python theme={null}
import shap
import matplotlib.pyplot as plt
def plot_shap_values(ds_column, title):
shap_df = nixtla_client.feature_contributions
shap_columns = shap_df.columns.difference(
["unique_id", ds_column, "TimeGPT", "base_value"]
)
shap_obj = shap.Explanation(
values=shap_df[shap_columns].values,
base_values=shap_df["base_value"].values,
feature_names=shap_columns,
)
shap.plots.bar(shap_obj, max_display=len(shap_columns), show=False)
plt.title(title)
plt.show()
plot_shap_values(ds_column="month", title="SHAP values for holidays")
```
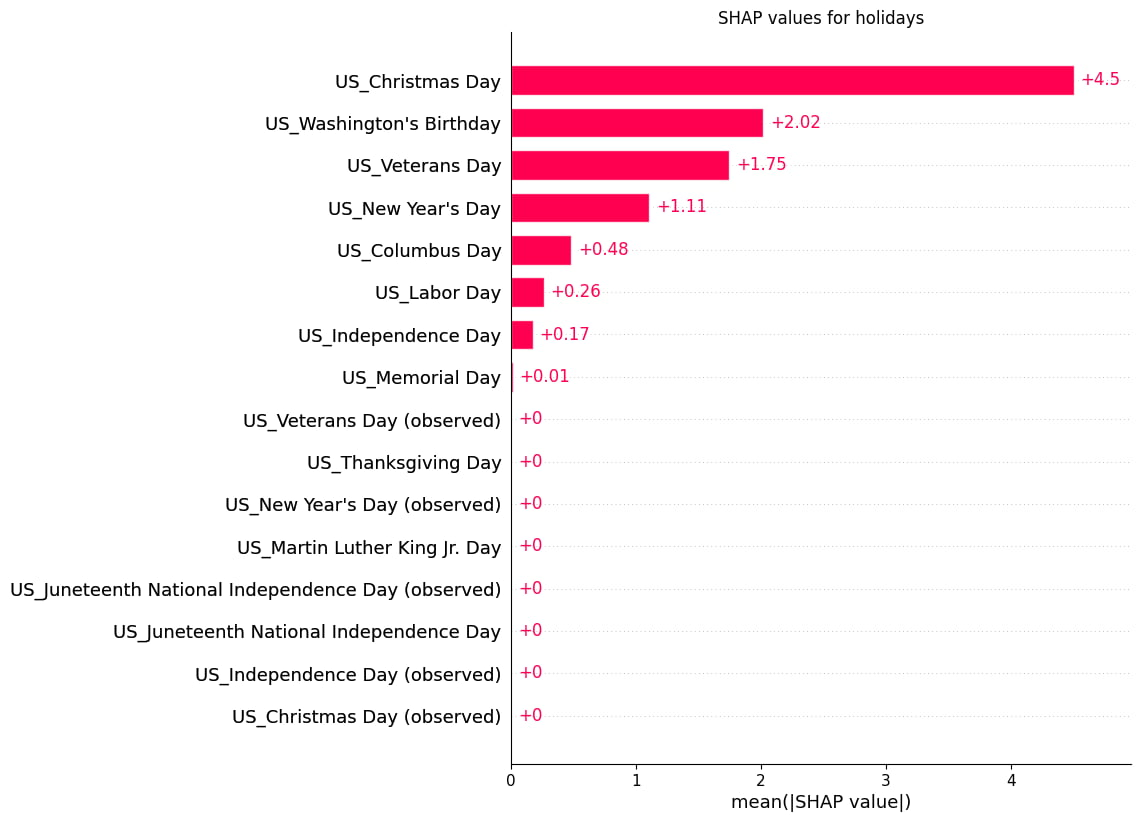 The SHAP values reveal that Christmas, Independence Day, and Labor Day have the strongest influence on chocolate interest forecasting. These holidays show the highest feature importance weights, indicating they significantly impact consumer behavior patterns. This aligns with expectations since these are major US holidays associated with gift-giving, celebrations, and seasonal consumption patterns that drive chocolate sales.
#### Add Special Dates
Beyond country holidays, you can create custom special dates with `SpecialDates`. These can represent unique one-time events or recurring patterns on specific dates of your choice.
Assume we already have a future DataFrame with monthly dates. We'll create Valentine's Day and Halloween as custom special dates and add them to the future DataFrame.
```python theme={null}
from nixtla.date_features import SpecialDates
# Generate special dates programmatically for the full data range (2004-2025)
valentine_dates = [f"{year}-02-14" for year in range(2004, 2026)]
halloween_dates = [f"{year}-10-31" for year in range(2004, 2026)]
# Define custom special dates - chocolate-related seasonal events
special_dates = SpecialDates(
special_dates={
"Valentine_season": valentine_dates,
"Halloween_season": halloween_dates,
}
)
# Apply special dates to future data
future_df_special = add_date_features_to_DataFrame(future_df, special_dates)
future_df_special.head()
```
| | month | Valentine\_season | Halloween\_season |
| -: | :------------------ | ----------------: | ----------------: |
| 0 | 2024-05-31 00:00:00 | 0 | 0 |
| 1 | 2024-06-30 00:00:00 | 0 | 0 |
| 2 | 2024-07-31 00:00:00 | 0 | 0 |
| 3 | 2024-08-31 00:00:00 | 0 | 0 |
| 4 | 2024-09-30 00:00:00 | 0 | 0 |
We will also add custom special dates to the historical DataFrame.
```python theme={null}
# Apply special dates to historical data as well
df_special = add_date_features_to_DataFrame(df, special_dates)
df_special.tail()
```
| | month | chocolate | Valentine\_season | Halloween\_season |
| --: | :------------------ | --------: | ----------------: | ----------------: |
| 239 | 2023-12-31 00:00:00 | 90 | 0 | 0 |
| 240 | 2024-01-31 00:00:00 | 64 | 0 | 0 |
| 241 | 2024-02-29 00:00:00 | 66 | 1 | 0 |
| 242 | 2024-03-31 00:00:00 | 59 | 0 | 0 |
| 243 | 2024-04-30 00:00:00 | 51 | 0 | 0 |
Now, forecast with the special date features.
```python theme={null}
fcst_df_special = nixtla_client.forecast(
df=df_special,
h=14,
freq="M",
time_col="month",
target_col="chocolate",
X_df=future_df_special,
model="timegpt-1-long-horizon",
feature_contributions=True,
)
```
Plot the forecast with special date effects.
```python theme={null}
nixtla_client.plot(
df_special,
fcst_df_special,
time_col='month',
target_col='chocolate',
)
```
The SHAP values reveal that Christmas, Independence Day, and Labor Day have the strongest influence on chocolate interest forecasting. These holidays show the highest feature importance weights, indicating they significantly impact consumer behavior patterns. This aligns with expectations since these are major US holidays associated with gift-giving, celebrations, and seasonal consumption patterns that drive chocolate sales.
#### Add Special Dates
Beyond country holidays, you can create custom special dates with `SpecialDates`. These can represent unique one-time events or recurring patterns on specific dates of your choice.
Assume we already have a future DataFrame with monthly dates. We'll create Valentine's Day and Halloween as custom special dates and add them to the future DataFrame.
```python theme={null}
from nixtla.date_features import SpecialDates
# Generate special dates programmatically for the full data range (2004-2025)
valentine_dates = [f"{year}-02-14" for year in range(2004, 2026)]
halloween_dates = [f"{year}-10-31" for year in range(2004, 2026)]
# Define custom special dates - chocolate-related seasonal events
special_dates = SpecialDates(
special_dates={
"Valentine_season": valentine_dates,
"Halloween_season": halloween_dates,
}
)
# Apply special dates to future data
future_df_special = add_date_features_to_DataFrame(future_df, special_dates)
future_df_special.head()
```
| | month | Valentine\_season | Halloween\_season |
| -: | :------------------ | ----------------: | ----------------: |
| 0 | 2024-05-31 00:00:00 | 0 | 0 |
| 1 | 2024-06-30 00:00:00 | 0 | 0 |
| 2 | 2024-07-31 00:00:00 | 0 | 0 |
| 3 | 2024-08-31 00:00:00 | 0 | 0 |
| 4 | 2024-09-30 00:00:00 | 0 | 0 |
We will also add custom special dates to the historical DataFrame.
```python theme={null}
# Apply special dates to historical data as well
df_special = add_date_features_to_DataFrame(df, special_dates)
df_special.tail()
```
| | month | chocolate | Valentine\_season | Halloween\_season |
| --: | :------------------ | --------: | ----------------: | ----------------: |
| 239 | 2023-12-31 00:00:00 | 90 | 0 | 0 |
| 240 | 2024-01-31 00:00:00 | 64 | 0 | 0 |
| 241 | 2024-02-29 00:00:00 | 66 | 1 | 0 |
| 242 | 2024-03-31 00:00:00 | 59 | 0 | 0 |
| 243 | 2024-04-30 00:00:00 | 51 | 0 | 0 |
Now, forecast with the special date features.
```python theme={null}
fcst_df_special = nixtla_client.forecast(
df=df_special,
h=14,
freq="M",
time_col="month",
target_col="chocolate",
X_df=future_df_special,
model="timegpt-1-long-horizon",
feature_contributions=True,
)
```
Plot the forecast with special date effects.
```python theme={null}
nixtla_client.plot(
df_special,
fcst_df_special,
time_col='month',
target_col='chocolate',
)
```
 Examine the feature importance of the special dates.
```python theme={null}
plot_shap_values(ds_column="month", title="SHAP values for special dates")
```
Examine the feature importance of the special dates.
```python theme={null}
plot_shap_values(ds_column="month", title="SHAP values for special dates")
```
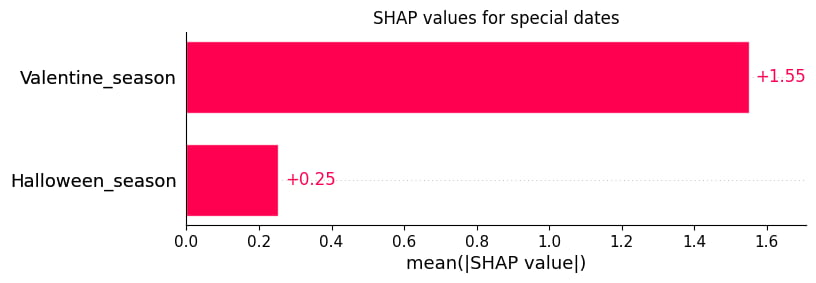 The SHAP values reveal that Valentine's Day has the strongest positive impact on chocolate sales forecasts. This aligns with consumer behavior patterns, as chocolate is a popular gift choice during Valentine's Day celebrations.
Congratulations! You have successfully integrated holiday and special date features into your time series forecasts. Use these steps as a starting point for further experimentation with advanced date features.
The SHAP values reveal that Valentine's Day has the strongest positive impact on chocolate sales forecasts. This aligns with consumer behavior patterns, as chocolate is a popular gift choice during Valentine's Day celebrations.
Congratulations! You have successfully integrated holiday and special date features into your time series forecasts. Use these steps as a starting point for further experimentation with advanced date features.